pysheds
🌎 Simple and fast watershed delineation in python
View the Project on GitHub mdbartos/pysheds
Basic concepts
• Rasters• Views
• File I/O
Hydrologic processing
• DEM conditioning• Flow directions
• Catchment delineation
• Flow accumulation
• Flow distance
• Extracting river networks
• Inundation mapping with HAND
Raster datasets
Grid methods operate on Raster objects. You can think of a Raster as a numpy array with additional attributes that specify the location, resolution and coordinate reference system of the data.
When a dataset is read from a file, it will automatically be saved as a Raster object.
from pysheds.grid import Grid

grid = Grid.from_raster('./data/dem.tif')
dem = grid.read_raster('./data/dem.tif')
Here, grid is the Grid instance, and dem is a Raster object. If we call the Raster object, we will see that it looks much like a numpy array.
dem
Output...
Raster([[214, 212, 210, ..., 177, 177, 175],
        [214, 210, 207, ..., 176, 176, 174],
        [211, 209, 204, ..., 174, 174, 174],
        ...,
        [263, 262, 263, ..., 217, 217, 216],
        [266, 265, 265, ..., 217, 217, 217],
        [268, 267, 266, ..., 216, 217, 216]], dtype=int16)
Calling methods on rasters
Hydrologic functions (such as flow direction determination and catchment delineation) accept and return Raster objects:
inflated_dem = grid.resolve_flats(dem)
fdir = grid.flowdir(inflated_dem)
fdir
Output...
Raster([[  0,   0,   0, ...,   0,   0,   0],
        [  0,   2,   2, ...,   4,   1,   0],
        [  0,   1,   2, ...,   4,   2,   0],
        ...,
        [  0,  64,  32, ...,   8,   1,   0],
        [  0,  64,  32, ...,  16, 128,   0],
        [  0,   0,   0, ...,   0,   0,   0]])
Raster attributes
Viewfinder
The viewfinder attribute contains all the information needed to specify the Raster’s spatial reference system. It can be accessed using the viewfinder attribute.
dem.viewfinder
Output...
'affine' : Affine(0.0008333333333333, 0.0, -97.4849999999961,
       0.0, -0.0008333333333333, 32.82166666666536)
'shape' : (359, 367)
'nodata' : -32768
'crs' : Proj('+proj=longlat +datum=WGS84 +no_defs', preserve_units=True)
'mask' : array([[ True,  True,  True, ...,  True,  True,  True],
       [ True,  True,  True, ...,  True,  True,  True],
       [ True,  True,  True, ...,  True,  True,  True],
       ...,
       [ True,  True,  True, ...,  True,  True,  True],
       [ True,  True,  True, ...,  True,  True,  True],
       [ True,  True,  True, ...,  True,  True,  True]])
The viewfinder contains five necessary elements that completely define the spatial reference system.
affine: An affine transformation matrix.shape: The desired shape (rows, columns).crs: The coordinate reference system.mask: A boolean array indicating which cells are masked.nodata: A sentinel value indicating ‘no data’.
Affine transformation matrix
An affine transform uniquely specifies the spatial location of each cell in a gridded dataset. In a Raster, the affine transform is given by the affine attribute.
dem.affine
Output...
Affine(0.0008333333333333, 0.0, -100.0,
       0.0, -0.0008333333333333, 34.9999999999998)
The elements of the affine transform (a, b, c, d, e, f) are:
- a: Horizontal scaling (equal to cell width if no rotation)
- b: Horizontal shear
- c: Horizontal translation (x-coordinate of upper-left corner of upper-leftmost cell)
- d: Vertical shear
- e: Vertical scaling (equal to cell height if no rotation)
- f: Vertical translation (y-coordinate of upper-left corner of upper-leftmost cell)
The affine transform uses the affine module.
Shape
The shape is equal to the shape of the underlying array (i.e. number of rows, number of columns).
dem.shape
Output...
(359, 367)
Coordinate reference system
The coordinate reference system (CRS) defines a map projection for the gridded
dataset. The crs attribute is a pyproj.Proj object. For datasets read from a
raster file, the CRS will be detected and populated automaticaally.
dem.crs
Output...
Proj('+proj=longlat +datum=WGS84 +no_defs', preserve_units=True)
This example dataset has a geographic projection (meaning that coordinates are defined in terms of latitudes and longitudes).
The coordinate reference system uses the pyproj module.
Mask
The mask is a boolean array indicating which cells in the dataset should be masked in the output view.
dem.mask
Output...
array([[ True,  True,  True, ...,  True,  True,  True],
       [ True,  True,  True, ...,  True,  True,  True],
       [ True,  True,  True, ...,  True,  True,  True],
       ...,
       [ True,  True,  True, ...,  True,  True,  True],
       [ True,  True,  True, ...,  True,  True,  True],
       [ True,  True,  True, ...,  True,  True,  True]])
“No data” value
The nodata attribute specifies the value that indicates missing or invalid data.
dem.nodata
Output...
-32768
Derived attributes
Other attributes are derived from these primary attributes:
Bounding box
dem.bbox
Output...
(-97.4849999999961, 32.52166666666537, -97.17833333332945, 32.82166666666536)
Extent
dem.extent
Output...
(-97.4849999999961, -97.17833333332945, 32.52166666666537, 32.82166666666536)
Coordinates
dem.coords
Output...
array([[ 32.82166667, -97.485     ],
       [ 32.82166667, -97.48416667],
       [ 32.82166667, -97.48333333],
       ...,
       [ 32.52333333, -97.18166667],
       [ 32.52333333, -97.18083333],
       [ 32.52333333, -97.18      ]])
Instantiating Rasters
Rasters can be instantiated directly using the pysheds.Raster class. Both an array-like object and a ViewFinder must be provided.
from pysheds.view import Raster, ViewFinder

array = np.random.randn(*grid.shape)
raster = Raster(array, viewfinder=grid.viewfinder)
Output...
raster

Raster([[-0.71876505, -0.35747123, -0.3296262 , ..., -0.07522118,
         -0.86431367, -0.45065405],
        [-1.12477409,  2.28759514,  0.5855458 , ..., -0.43795955,
          0.42813309,  0.03900371],
        [-1.33345727,  1.03254272,  0.0904066 , ...,  0.06465593,
         -1.09938815,  1.1821455 ],
        ...,
        [ 0.67330805,  0.37022934,  0.13783694, ..., -1.59943506,
          0.65154575, -0.58218991],
        [ 0.67738517,  0.43696016,  1.09402764, ..., -1.63815592,
          1.67867785,  0.16609381],
        [ 1.17302635,  0.31176851,  1.79257942, ..., -0.48385788,
          1.38478075, -0.76431488]])
We can also instantiate the raster using our own custom ViewFinder.
raster = Raster(array, viewfinder=ViewFinder(shape=array.shape))
Note that the affine transformation defaults to the identity matrix, the nodata value defaults to zero, the crs defaults to geographic coordinates, and the mask defaults to a boolean array of ones. If a shape is not provided, the shape of the viewfinder defaults to (1, 1). However, when instantiating a Raster, the shape of the viewfinder and the shape of the array-like object must be identical.
raster.viewfinder
Output...
'affine' : Affine(1.0, 0.0, 0.0,
       0.0, 1.0, 0.0)
'shape' : (359, 367)
'nodata' : 0
'crs' : Proj('+proj=longlat +datum=WGS84 +no_defs', preserve_units=True)
'mask' : array([[ True,  True,  True, ...,  True,  True,  True],
       [ True,  True,  True, ...,  True,  True,  True],
       [ True,  True,  True, ...,  True,  True,  True],
       ...,
       [ True,  True,  True, ...,  True,  True,  True],
       [ True,  True,  True, ...,  True,  True,  True],
       [ True,  True,  True, ...,  True,  True,  True]])
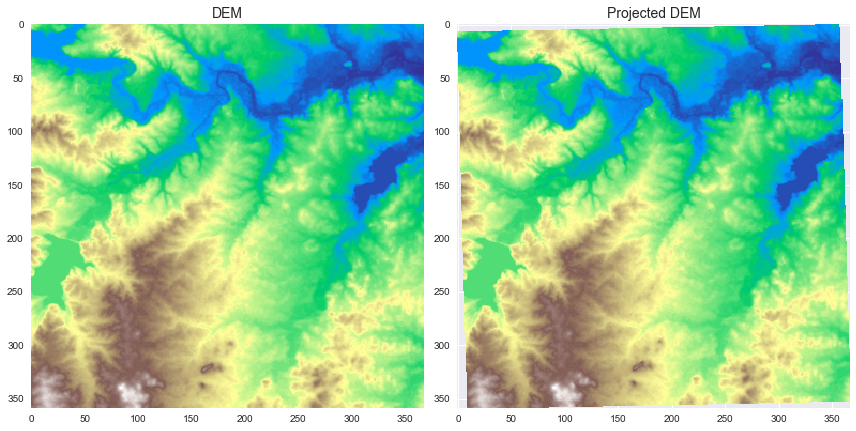
Converting the Raster coordinate reference system
The Raster can be transformed to a new coordinate reference system using the to_crs method:
import pyproj
import numpy as np

# Initialize new CRS
new_crs = pyproj.Proj('epsg:3083')

# Convert CRS of dataset and set nodata value for better plotting
dem.nodata = np.nan
proj_dem = dem.to_crs(new_crs)
Plotting code...
import matplotlib.pyplot as plt
import seaborn as sns

fig, ax = plt.subplots(1, 2, figsize=(12,8))
fig.patch.set_alpha(0)
ax[0].imshow(dem, cmap='terrain', zorder=1)
ax[1].imshow(proj_dem, cmap='terrain', zorder=1)
ax[0].set_title('DEM', size=14)
ax[1].set_title('Projected DEM', size=14)
plt.tight_layout()
Note that the projected Raster appears slightly rotated to the counterclockwise direction.