pysheds
🌎 Simple and fast watershed delineation in python
View the Project on GitHub mdbartos/pysheds
Basic concepts
• Rasters• Views
• File I/O
Hydrologic processing
• DEM conditioning• Flow directions
• Catchment delineation
• Flow accumulation
• Flow distance
• Extracting river networks
• Inundation mapping with HAND
Flow distance
Preliminaries
The grid.distance_to_outlet method operates on a flow direction grid. This flow direction grid can be computed from a DEM, as shown in flow directions.
import numpy as np
from matplotlib import pyplot as plt
import seaborn as sns
from pysheds.grid import Grid

# Instantiate grid from raster
grid = Grid.from_raster('./data/dem.tif')
dem = grid.read_raster('./data/dem.tif')

# Resolve flats and compute flow directions
inflated_dem = grid.resolve_flats(dem)
fdir = grid.flowdir(inflated_dem)
Computing flow distance
Flow distance is computed using the grid.distance_to_outlet method:
# Specify outlet
x, y = -97.294167, 32.73750

# Delineate a catchment
catch = grid.catchment(x=x, y=y, fdir=fdir, xytype='coordinate')

# Clip the view to the catchment
grid.clip_to(catch)

# Compute distance to outlet
dist = grid.distance_to_outlet(x, y, fdir=fdir, xytype='coordinate')
Plotting code...
fig, ax = plt.subplots(figsize=(8,6))
fig.patch.set_alpha(0)
plt.grid('on', zorder=0)
im = ax.imshow(dist, extent=grid.extent, zorder=2,
               cmap='cubehelix_r')
plt.colorbar(im, ax=ax, label='Distance to outlet (cells)')
plt.xlabel('Longitude')
plt.ylabel('Latitude')
plt.title('Distance to outlet', size=14)
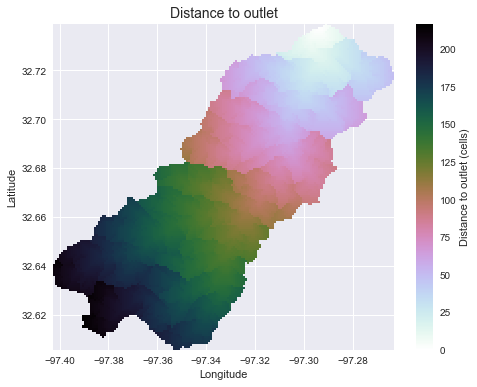
Note that the grid.flow_distance method requires an outlet point, much like the grid.catchment method.
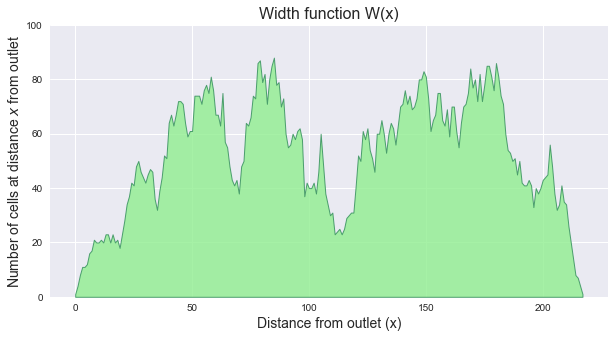
Width function
The width function of a catchment W(x) represents the number of cells located at a topological distance x from the outlet. One can compute the width function of the catchment by counting the number of cells at a distance x from the outlet for each distance x.
# Compute width function
W = np.bincount(dist[np.isfinite(dist)].astype(int))
Plotting code...
fig, ax = plt.subplots(figsize=(10, 5))
plt.fill_between(np.arange(len(W)), W, 0, edgecolor='seagreen', linewidth=1, facecolor='lightgreen', alpha=0.8)
plt.ylim(0, 100)
plt.ylabel(r'Number of cells at distance $x$ from outlet', size=14)
plt.xlabel(r'Distance from outlet (x)', size=14)
plt.title('Width function W(x)', size=16)
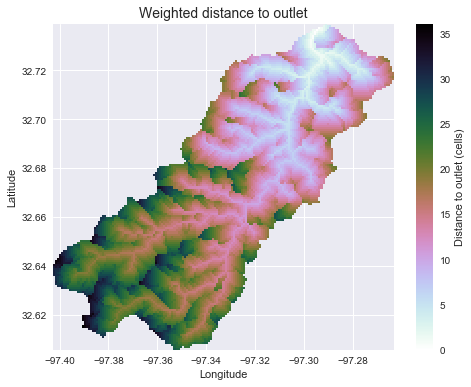
Computing weighted flow distance
Weights can be used to adjust the distance metric between cells. This can be useful if, for instance, the travel time between cells depends on characteristics such as slope, land cover, or channelization. In the following example, we will compute the weighted flow distance assuming that water in channelized cells flows 10 times faster than in hillslope cells.
# Clip the bounding box to the catchment
grid.clip_to(catch)

# Compute flow accumulation
acc = grid.accumulation(fdir)

# Assume that water in channelized cells (>= 100 accumulation) travels 10 times faster
# than hillslope cells (< 100 accumulation)
weights = acc.copy()
weights[acc >= 100] = 0.1
weights[(0 < acc) & (acc < 100)] = 1.

# Compute weighted distance to outlet
dist = grid.distance_to_outlet(x=x, y=y, fdir=fdir, weights=weights, xytype='coordinate')
Plotting code...
fig, ax = plt.subplots(figsize=(8,6))
fig.patch.set_alpha(0)
plt.grid('on', zorder=0)
im = ax.imshow(dist, extent=grid.extent, zorder=2,
               cmap='cubehelix_r')
plt.colorbar(im, ax=ax, label='Distance to outlet (cells)')
plt.xlabel('Longitude')
plt.ylabel('Latitude')
plt.title('Weighted distance to outlet', size=14)
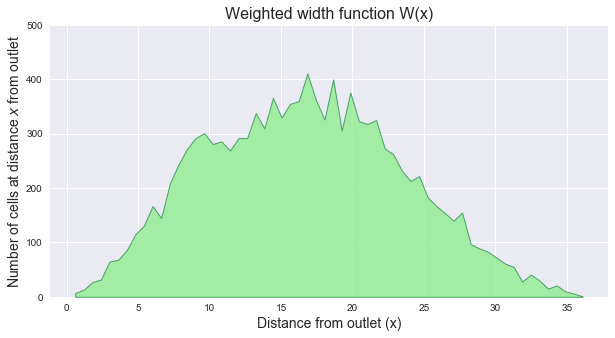
Weighted width function
Note that because the distances are no longer integers, the weighted width function must bin the input distances.
# Compute weighted width function
distances = dist[np.isfinite(dist)].ravel()
hist, bin_edges = np.histogram(distances, range=(0,distances.max()+1e-5),
                               bins=60)
Plotting code...
fig, ax = plt.subplots(figsize=(10, 5))
plt.fill_between(bin_edges[1:], hist, 0, edgecolor='seagreen', linewidth=1, facecolor='lightgreen', alpha=0.8)
plt.ylim(0, 500)
plt.ylabel(r'Number of cells at distance $x$ from outlet', size=14)
plt.xlabel(r'Distance from outlet (x)', size=14)
plt.title('Weighted width function W(x)', size=16)