pysheds
🌎 Simple and fast watershed delineation in python
View the Project on GitHub mdbartos/pysheds
Basic concepts
• Rasters• Views
• File I/O
Hydrologic processing
• DEM conditioning• Flow directions
• Catchment delineation
• Flow accumulation
• Flow distance
• Extracting river networks
• Inundation mapping with HAND
Accumulation
Preliminaries
The grid.accumulation method operates on a flow direction grid. This flow direction grid can be computed from a DEM, as shown in flow directions.
from pysheds.grid import Grid

# Instantiate grid from raster
grid = Grid.from_raster('./data/dem.tif')
dem = grid.read_raster('./data/dem.tif')

# Resolve flats and compute flow directions
inflated_dem = grid.resolve_flats(dem)
fdir = grid.flowdir(inflated_dem)
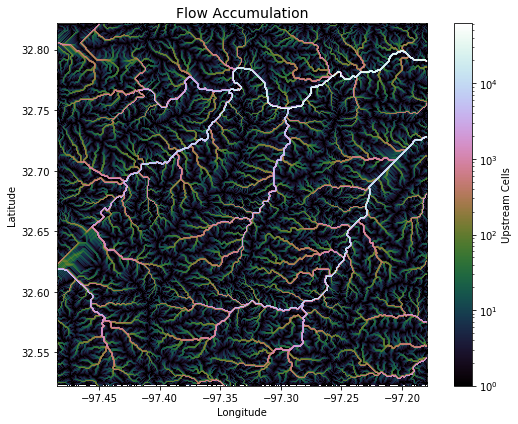
Computing accumulation
Accumulation is computed using the grid.accumulation method.
# Compute accumulation
acc = grid.accumulation(fdir)
Plotting code...
import matplotlib.pyplot as plt
import matplotlib.colors as colors

fig, ax = plt.subplots(figsize=(8,6))
fig.patch.set_alpha(0)
plt.grid('on', zorder=0)
im = ax.imshow(acc, extent=grid.extent, zorder=2,
               cmap='cubehelix',
               norm=colors.LogNorm(1, acc.max()),
               interpolation='bilinear')
plt.colorbar(im, ax=ax, label='Upstream Cells')
plt.title('Flow Accumulation', size=14)
plt.xlabel('Longitude')
plt.ylabel('Latitude')
plt.tight_layout()