pysheds
🌎 Simple and fast watershed delineation in python
View the Project on GitHub mdbartos/pysheds
Basic concepts
• Rasters• Views
• File I/O
Hydrologic processing
• DEM conditioning• Flow directions
• Catchment delineation
• Flow accumulation
• Flow distance
• Extracting river networks
• Inundation mapping with HAND
Inundation mapping with HAND
The HAND function can be used to estimate inundation extent.
Computing the height above nearest drainage
First, we begin by computing the flow directions and accumulation for a given DEM.
import numpy as np
from pysheds.grid import Grid

# Instantiate grid from raster
grid = Grid.from_raster('./data/dem.tif')
dem = grid.read_raster('./data/dem.tif')

# Resolve flats and compute flow directions
inflated_dem = grid.resolve_flats(dem)
fdir = grid.flowdir(inflated_dem)

# Compute accumulation
acc = grid.accumulation(fdir)
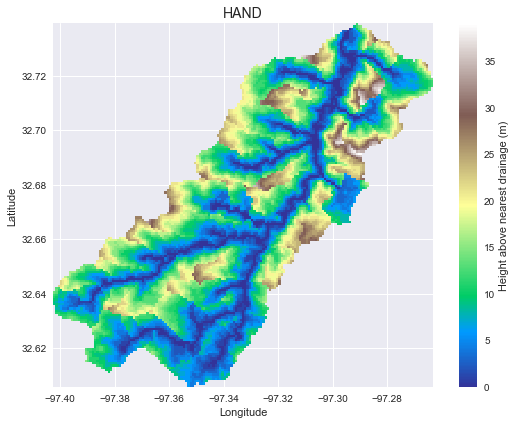
We can then compute the height above nearest drainage (HAND) by providing a DEM, a flow direction grid, and a channel mask. For this demonstration, we will take the channel mask to be all cells with accumulation greater than 200.
# Compute height above nearest drainage
hand = grid.compute_hand(fdir, dem, acc > 200)
Next, we will clip the HAND raster to a catchment to make it easier to work with.
# Specify outlet
x, y = -97.294167, 32.73750

# Delineate a catchment
catch = grid.catchment(x=x, y=y, fdir=fdir, xytype='coordinate')

# Clip to the catchment
grid.clip_to(catch)

# Create a view of HAND in the catchment
hand_view = grid.view(hand, nodata=np.nan)
Plotting code...
from matplotlib import pyplot as plt
import seaborn as sns
fig, ax = plt.subplots(figsize=(8,6))
fig.patch.set_alpha(0)
plt.imshow(hand_view,
           extent=grid.extent, cmap='terrain', zorder=1)
plt.colorbar(label='Height above nearest drainage (m)')
plt.grid(zorder=0)
plt.title('HAND', size=14)
plt.xlabel('Longitude')
plt.ylabel('Latitude')
plt.tight_layout()
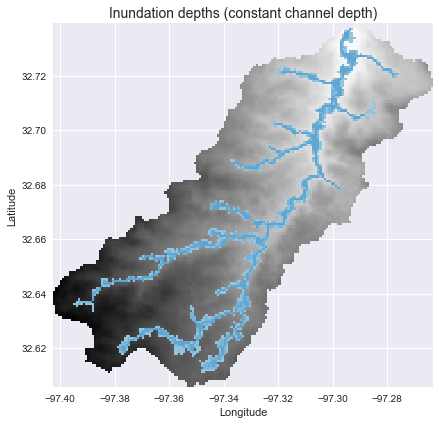
Estimating inundation extent (constant channel depth)
We can estimate the inundation extent (assuming a constant channel depth) using a simple binary threshold:
inundation_extent = np.where(hand_view < 3, 3 - hand_view, np.nan)
Plotting code...
fig, ax = plt.subplots(figsize=(8,6))
fig.patch.set_alpha(0)
dem_view = grid.view(dem, nodata=np.nan)
plt.imshow(dem_view, extent=grid.extent, cmap='Greys', zorder=1)
plt.imshow(inundation_extent, extent=grid.extent,
           cmap='Blues', vmin=-5, vmax=10, zorder=2)
plt.grid(zorder=0)
plt.title('Inundation depths (constant channel depth)', size=14)
plt.xlabel('Longitude')
plt.ylabel('Latitude')
plt.tight_layout()
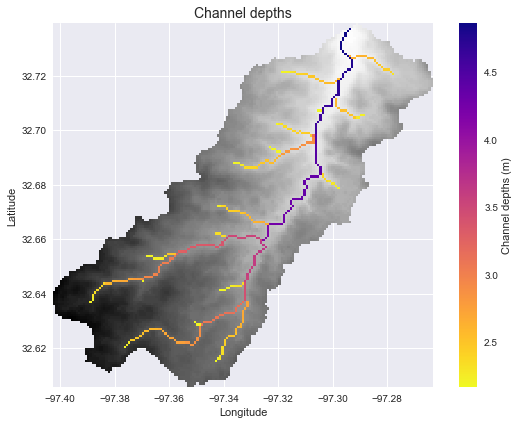
Estimating inundation extent (varying channel depth)
We can also estimate the inundation extent given a continuously varying channel depth. First, for the purposes of demonstration, we can generate an estimate of the channel depths using a power law formulation:
# Clip accumulation to current view
acc_view = grid.view(acc, nodata=np.nan)

# Create empirical channel depths based on power law
channel_depths = np.where(acc_view > 200, 0.75 * acc_view**0.2, 0)
Plotting code...
fig, ax = plt.subplots(figsize=(8,6))
fig.patch.set_alpha(0)
dem_view = grid.view(dem, nodata=np.nan)
plt.imshow(dem_view, extent=grid.extent, cmap='Greys', zorder=1)
plt.imshow(np.where(acc_view > 200, channel_depths, np.nan),
           extent=grid.extent, cmap='plasma_r', zorder=2)
plt.colorbar(label='Channel depths (m)')
plt.grid(zorder=0)
plt.title('Channel depths', size=14)
plt.xlabel('Longitude')
plt.ylabel('Latitude')
plt.tight_layout()
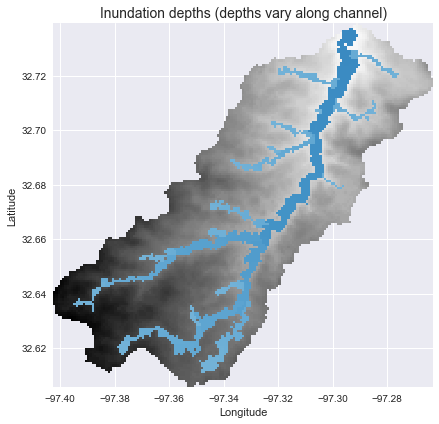
To find the corresponding depths in the non-channel cells, we can use the return_index=True argument in the compute_hand function to return the index of the channel cell that is topologically nearest to each cell in the DEM. We can then estimate the inundation depth at each cell:
# Compute index of nearest channel cell for each cell
hand_idx = grid.compute_hand(fdir, dem, acc > 200, return_index=True)
hand_idx_view = grid.view(hand_idx, nodata=0)

# Compute inundation depths
inundation_depths = np.where(hand_idx_view, channel_depths.flat[hand_idx_view], np.nan)
Plotting code...
fig, ax = plt.subplots(figsize=(8,6))
fig.patch.set_alpha(0)
dem_view = grid.view(dem, nodata=np.nan)
plt.imshow(dem_view, extent=grid.extent, cmap='Greys', zorder=1)
plt.imshow(np.where(hand_view < inundation_depths, inundation_depths, np.nan), extent=grid.extent,
           cmap='Blues', vmin=-5, vmax=10, zorder=2)
plt.grid(zorder=0)
plt.title('Inundation depths (depths vary along channel)', size=14)
plt.xlabel('Longitude')
plt.ylabel('Latitude')
plt.tight_layout()