pysheds
🌎 Simple and fast watershed delineation in python
View the Project on GitHub mdbartos/pysheds
Basic concepts
• Rasters• Views
• File I/O
Hydrologic processing
• DEM conditioning• Flow directions
• Catchment delineation
• Flow accumulation
• Flow distance
• Extracting river networks
• Inundation mapping with HAND
DEM conditioning
Raw DEMs often contain artifacts (such as depressions and flat regions) that prevent the DEM from fully draining. In this section, methods for removing these artifacts are discussed.
Depressions
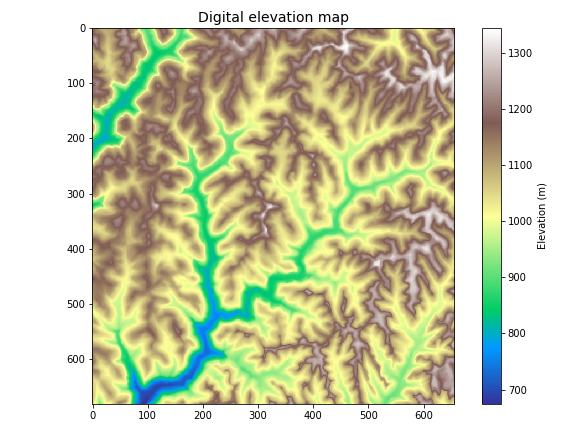
Raw DEMs often contain depressions that must be removed before further processing. Depressions consist of regions of cells for which every surrounding cell is at a higher elevation. The following DEM contains natural depressions:
Preliminaries
# Import modules
import matplotlib.pyplot as plt
import matplotlib.colors as colors
from pysheds.grid import Grid

%matplotlib inline

# Read raw DEM
grid = Grid.from_raster('./data/roi_10m')
dem = grid.read_raster('./data/roi_10m')
Plotting code...
# Plot the raw DEM
fig, ax = plt.subplots(figsize=(8,6))
fig.patch.set_alpha(0)

plt.imshow(grid.view(dem), cmap='terrain', zorder=1)
plt.colorbar(label='Elevation (m)')
plt.title('Digital elevation map', size=14)
plt.tight_layout()
Detecting pits
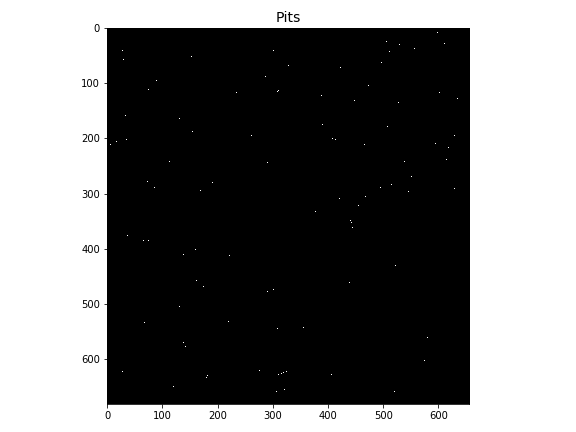
Pits can be detected using the grid.detect_depressions method:
# Detect pits
pits = grid.detect_pits(dem)
Plotting code...
# Plot pits
fig, ax = plt.subplots(figsize=(8,6))
fig.patch.set_alpha(0)

plt.imshow(pits, cmap='Greys_r', zorder=1)
plt.title('Pits', size=14)
plt.tight_layout()
Filling pits
Pits can be filled using the grid.fill_depressions method:
# Fill pits
pit_filled_dem = grid.fill_pits(dem)
pits = grid.detect_pits(pit_filled_dem)
assert not pits.any()
Detecting depressions
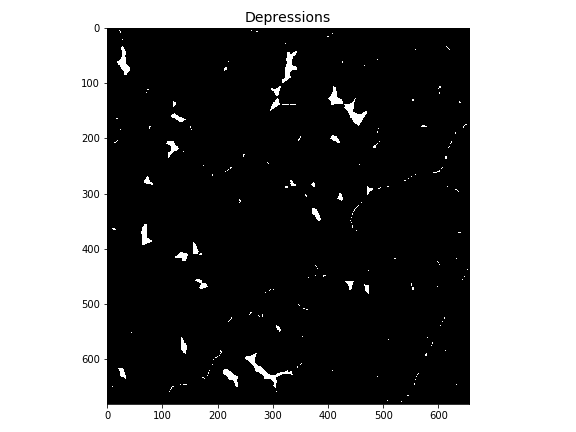
Depressions can be detected using the grid.detect_depressions method:
# Detect depressions
depressions = grid.detect_depressions(pit_filled_dem)
Plotting code...
# Plot depressions
fig, ax = plt.subplots(figsize=(8,6))
fig.patch.set_alpha(0)

plt.imshow(depressions, cmap='Greys_r', zorder=1)
plt.title('Depressions', size=14)
plt.tight_layout()
Filling depressions
Depressions can be filled using the grid.fill_depressions method:
# Fill depressions
flooded_dem = grid.fill_depressions(pit_filled_dem)
depressions = grid.detect_depressions(flooded_dem)
assert not depressions.any()
Flats
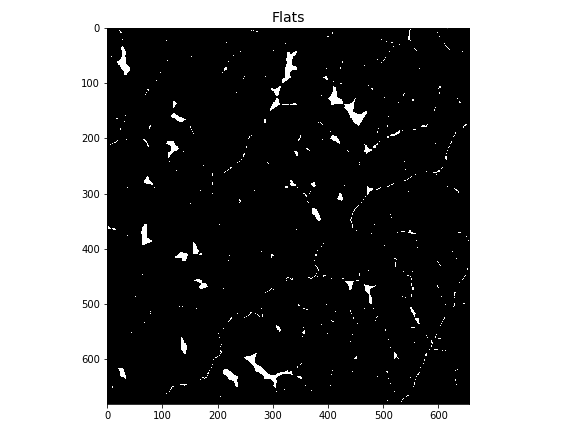
Flats consist of cells at which every surrounding cell is at the same elevation or higher. Note that we have created flats by filling in our pits and depressions.
Detecting flats
Flats can be detected using the grid.detect_flats method:
# Detect flats
flats = grid.detect_flats(flooded_dem)
Plotting code...
# Plot flats
fig, ax = plt.subplots(figsize=(8,6))
fig.patch.set_alpha(0)

plt.imshow(flats, cmap='Greys_r', zorder=1)
plt.title('Flats', size=14)
plt.tight_layout()
Resolving flats
Flats can be resolved using the grid.resolve_flats method:
inflated_dem = grid.resolve_flats(flooded_dem)
flats = grid.detect_flats(inflated_dem)
assert not flats.any()
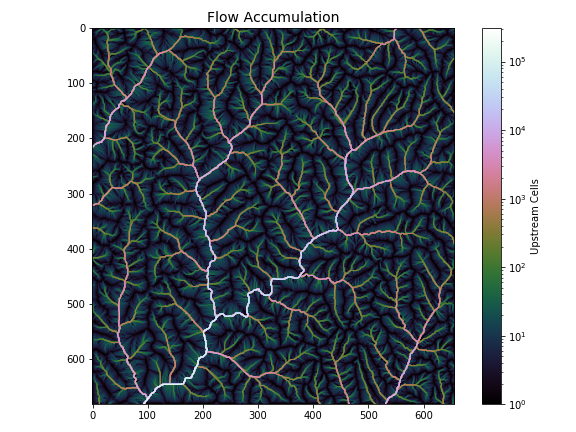
Finished product
After filling depressions and resolving flats, the flow direction can be determined as usual:
# Compute flow direction based on corrected DEM
fdir = grid.flowdir(inflated_dem)

# Compute flow accumulation based on computed flow direction
acc = grid.accumulation(fdir)
Plotting code...
fig, ax = plt.subplots(figsize=(8,6))
fig.patch.set_alpha(0)
im = ax.imshow(acc, zorder=2,
               cmap='cubehelix',
               norm=colors.LogNorm(1, acc.max()),
               interpolation='bilinear')
plt.colorbar(im, ax=ax, label='Upstream Cells')
plt.title('Flow Accumulation', size=14)
plt.tight_layout()
Burning DEMs
Burning existing streamlines into a DEM is common practice for some applications. In pysheds, DEMs can be burned through a combination of boolean masking and simple addition or subtraction.