pysheds
🌎 Simple and fast watershed delineation in python
View the Project on GitHub mdbartos/pysheds
Basic concepts
• Rasters• Views
• File I/O
Hydrologic processing
• DEM conditioning• Flow directions
• Catchment delineation
• Flow accumulation
• Flow distance
• Extracting river networks
• Inundation mapping with HAND
Catchment delineation
Preliminaries
The grid.catchment method operates on a flow direction grid. This flow direction grid can be computed from a DEM, as shown in flow directions.
from pysheds.grid import Grid

# Instantiate grid from raster
grid = Grid.from_raster('./data/dem.tif')
dem = grid.read_raster('./data/dem.tif')

# Resolve flats and compute flow directions
inflated_dem = grid.resolve_flats(dem)
fdir = grid.flowdir(inflated_dem)
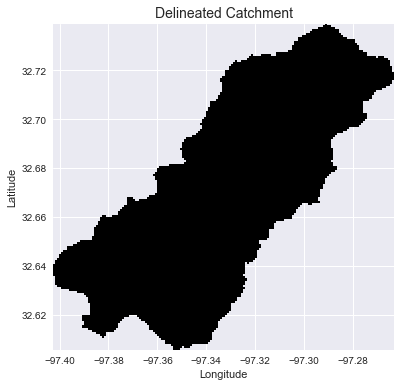
Delineating the catchment
To delineate a catchment, first specify a pour point (the outlet of the catchment). If the x and y components of the pour point are spatial coordinates in the grid’s spatial reference system, specify xytype='coordinate'.
# Specify pour point
x, y = -97.294167, 32.73750

# Delineate the catchment
catch = grid.catchment(x=x, y=y, fdir=fdir, xytype='coordinate')

# Plot the result
grid.clip_to(catch)
catch_view = grid.view(catch)
Plotting code...
# Plot the catchment
fig, ax = plt.subplots(figsize=(8,6))
fig.patch.set_alpha(0)

plt.grid('on', zorder=0)
im = ax.imshow(np.where(catch_view, catch_view, np.nan), extent=grid.extent,
               zorder=1, cmap='Greys_r')
plt.xlabel('Longitude')
plt.ylabel('Latitude')
plt.title('Delineated Catchment', size=14)
If the x and y components of the pour point correspond to the row and column indices of the flow direction array, specify xytype='index':
# Reset the view
grid.viewfinder = fdir.viewfinder

# Find the row and column index corresponding to the pour point
col, row = grid.nearest_cell(x, y)

# Delineate the catchment
catch = grid.catchment(x=col, y=row, fdir=fdir, xytype='index')

# Plot the result
grid.clip_to(catch)
catch_view = grid.view(catch)
Plotting code...
# Plot the catchment
fig, ax = plt.subplots(figsize=(8,6))
fig.patch.set_alpha(0)

plt.grid('on', zorder=0)
im = ax.imshow(np.where(catch_view, catch_view, np.nan), extent=grid.extent,
               zorder=1, cmap='Greys_r')
plt.xlabel('Longitude')
plt.ylabel('Latitude')
plt.title('Delineated Catchment', size=14)
Snapping pour point to high accumulation cells
Sometimes the pour point isn’t known exactly. In this case, it can be helpful to first compute the accumulation and then snap a trial pour point to the nearest high accumulation cell.
# Reset view
grid.viewfinder = fdir.viewfinder

# Compute accumulation
acc = grid.accumulation(fdir)

# Snap pour point to high accumulation cell
x_snap, y_snap = grid.snap_to_mask(acc > 1000, (x, y))


# Delineate the catchment
catch = grid.catchment(x=x_snap, y=y_snap, fdir=fdir, xytype='coordinate')

# Plot the result
grid.clip_to(catch)
catch_view = grid.view(catch)
Plotting code...
# Plot the catchment
fig, ax = plt.subplots(figsize=(8,6))
fig.patch.set_alpha(0)

plt.grid('on', zorder=0)
im = ax.imshow(np.where(catch_view, catch_view, np.nan), extent=grid.extent,
               zorder=1, cmap='Greys_r')
plt.xlabel('Longitude')
plt.ylabel('Latitude')
plt.title('Delineated Catchment', size=14)